


Europe's free satellite service just made it easier to track wildfires
Copernicus Browser adds wildfire visualization amid record wildfire season.
The wildfires afflicting communities across the world can now be tracked more easily by anyone using Europe’s free and open satellite imagery service—all thanks to a wildfire visualization script originating from nearly a decade ago.
The Copernicus Browser provides free access to the latest satellite imagery taken by the European Space Agency’s Sentinel satellites for the European Union’s Earth observation program. The three satellites of the Sentinel-2 mission have proven especially useful for wildfire monitoring by providing multi-spectral imaging at resolutions as granular as 10 meters in visible light and near-infrared bands—and the Copernicus Browser previously offered 10 default visualization layers using different combinations of spectral bands.
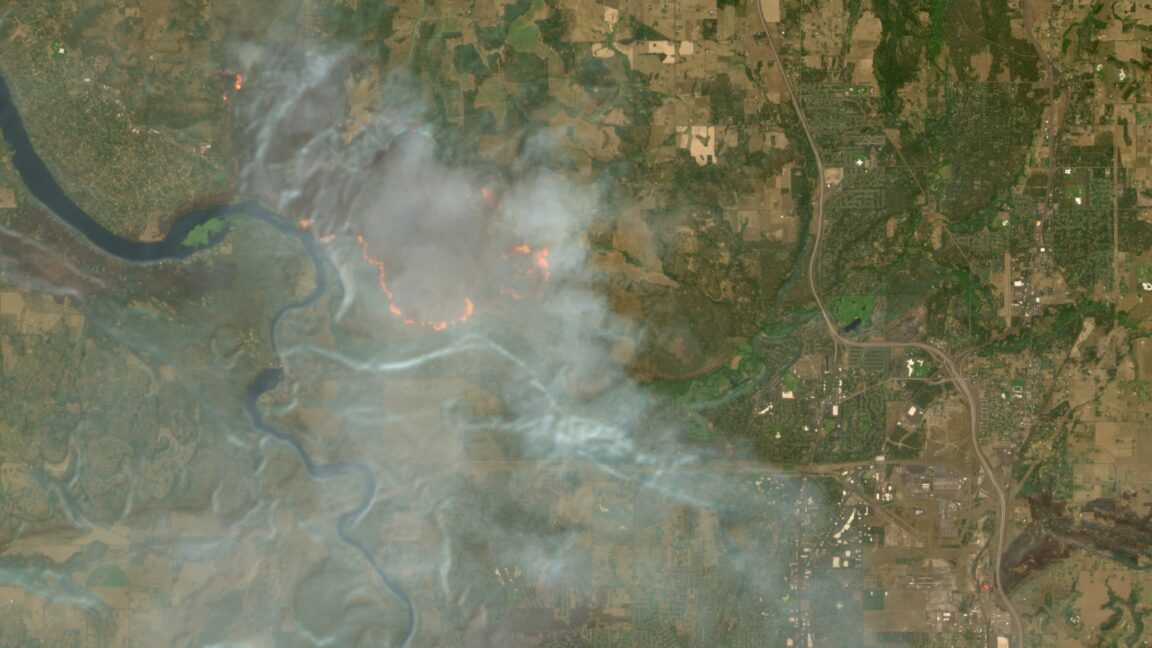
Now Copernicus Browser has also added a straightforward “wildfires” visualization layer for Sentinel-2 imagery that went live on August 4. Anyone clicking on this layer while looking at a wildfire location can see active fires in white or yellow, burning vegetation in red, and burned landscapes in dark brown or black.