


Americans spend a lot of time sleeping, working, and relaxing. Take our quiz to see how you compare.
Take this quiz to see how your hours a day spent sleeping, working, and on other activities compare to how Americans spent their time last year.
Getty Images
- From work to making meals and taking care of children, Americans can accomplish a lot in a day.
- The latest American Time Use Survey results showed how people spent their time in 2025.
- Take this quiz to see how your day compares.
What do you spend your day doing?
The Bureau of Labor Statistics published new results from the 2025 American Time Use Survey, showing how many hours a day, on average, were spent doing different primary activities.
Americans from young adults to Gen Xers devoted large chunks to sleeping, work-related activities, and leisure. Teens spent more time a day on educational activities than other groups, while people who were at least in their mid-60s spent more time than others on household activities. Men spent more time than women working, while women spent more time on household activities.
You can take the quiz below to see how your day compares to the survey results.
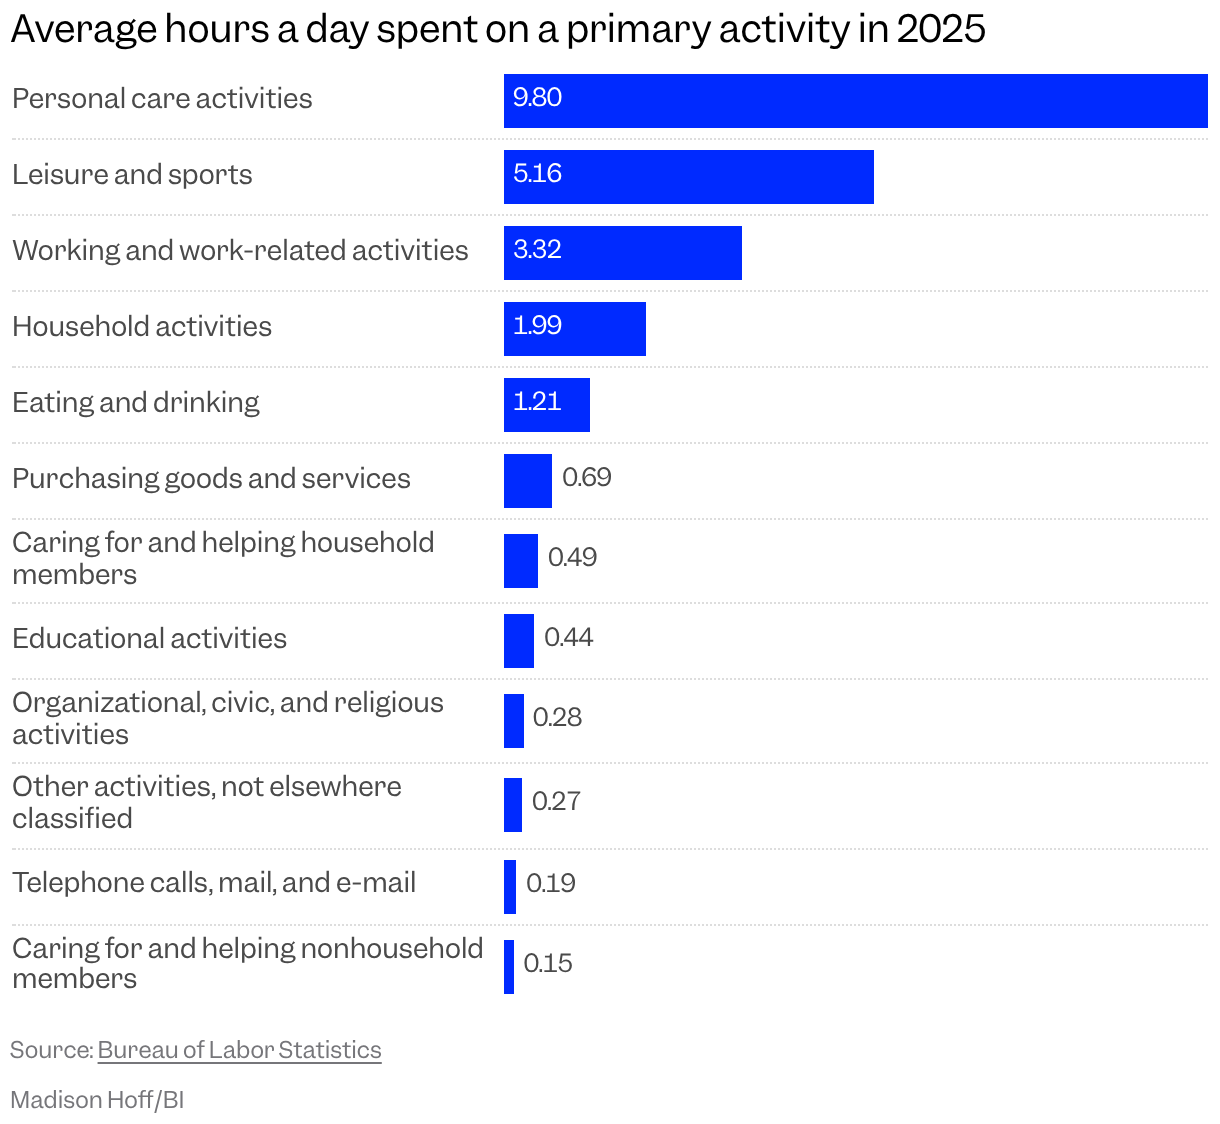
On average, personal care took up the most time; this category includes activities such as sleeping, showering, and hair care. Slightly more time was spent on this on the weekend and holidays than on weekdays — at 10.44 and 9.53 hours respectively. Household activities averaged about 2 hours a day, with food preparation and cleanup taking 0.7 hours. These averages include those who didn't participate in activities.
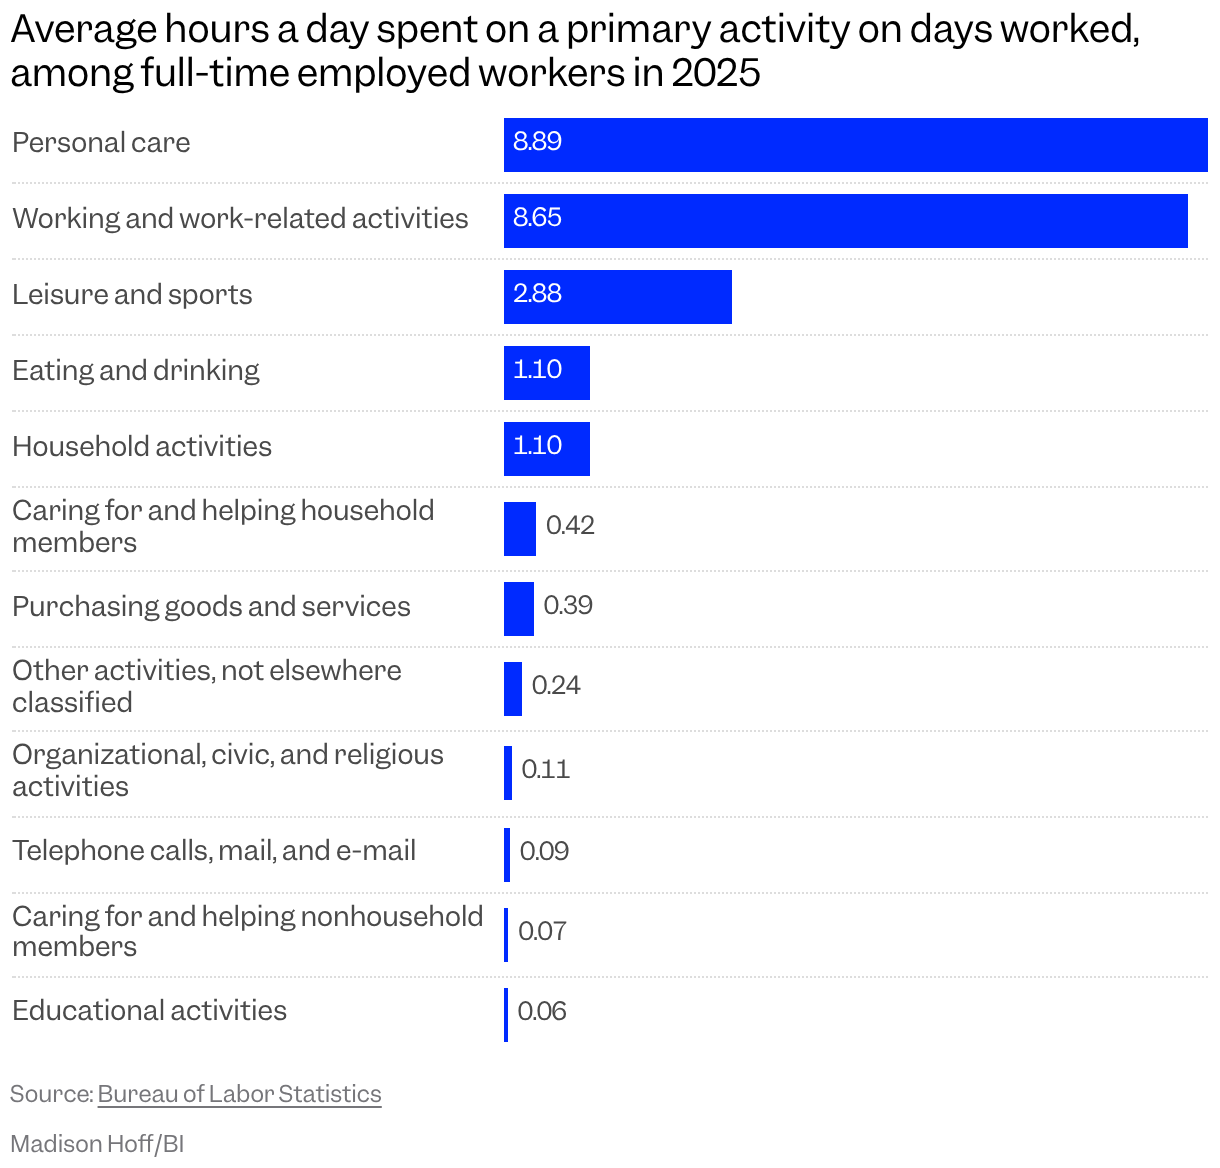
The new data also shows how workers spend their day. They're spending just as much time on personal care as on work. Full-time employed people spent 8.45 hours on a weekday and 5.49 hours on a weekend day working. People with at least a bachelor's degree spent fewer hours working than those with other educational attainments.
On days worked, employed full-time people spent about 3 hours a day on average on leisure and sports, about an hour on household activities, and about an hour on eating and drinking.
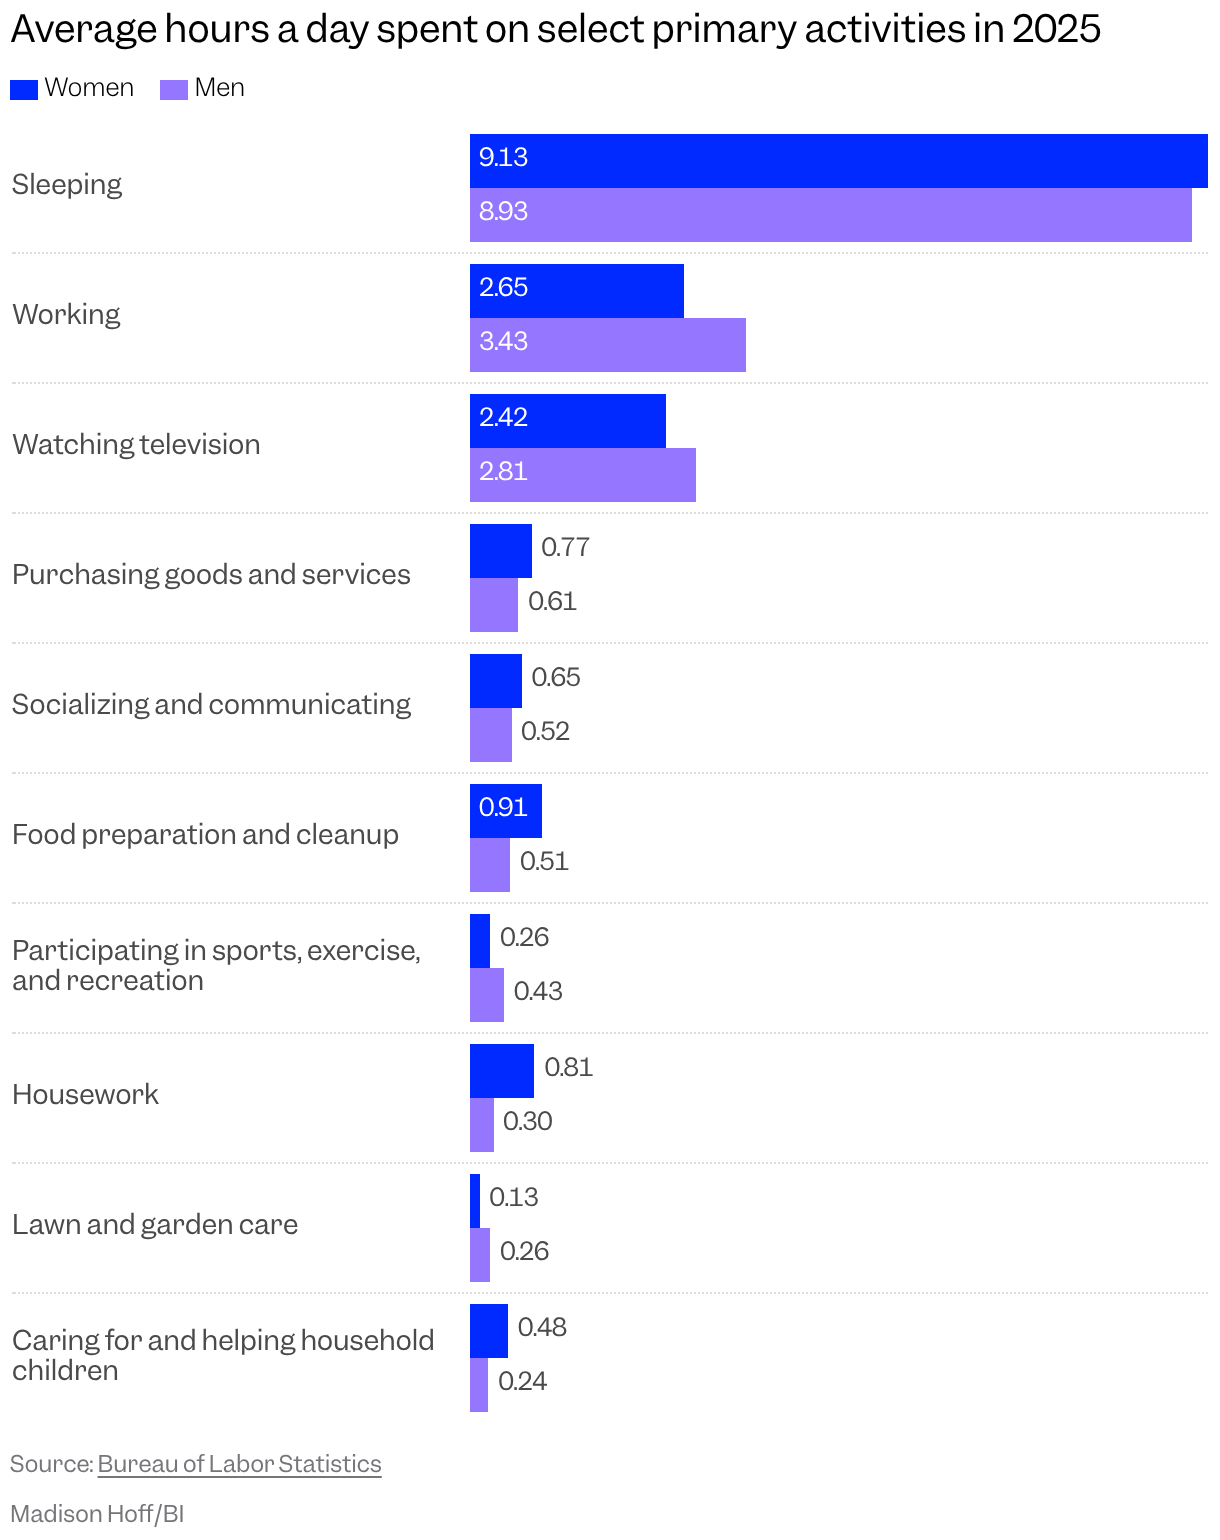
Women spent more time a day on average than men on housework, food prep, and caring for children. Meanwhile, men spent more time on lawn and garden care, working, and sports, exercise, and recreation.
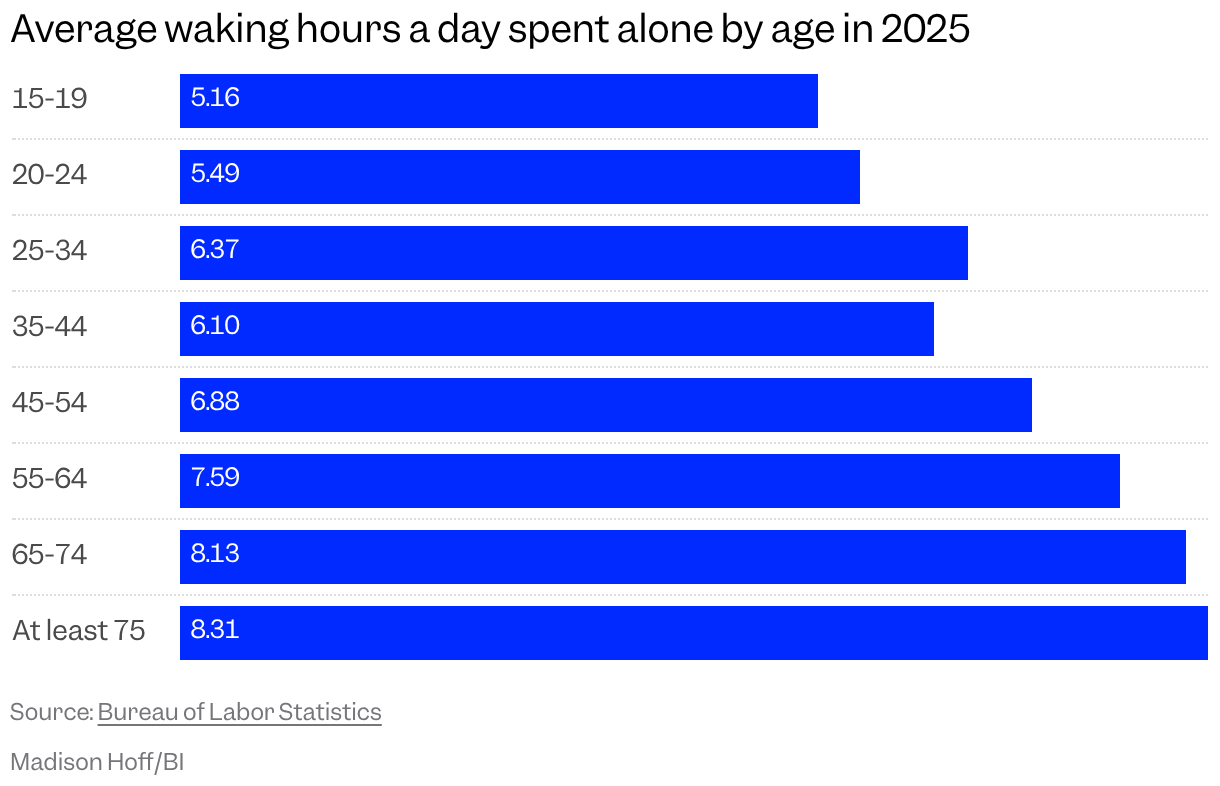
As age rose, so did hours spent alone. Unemployed people spent more time alone than those working, 7.11 waking hours and 6.63, respectively.
 Read the original article on Business Insider